ESRI founder, president and Geographical Information Systems (GIS) visionary Jack Dangermond gave the keynote address to the 2003 ESRI Petroleum User Group. According to Dangermond, GIS use is growing, driven by a ‘science-based approach to decision making and problem solving in industry’. Influences as diverse as a rising oil price, infrastructure vulnerability, pipeline regulations and IT standards are forcing widespread adoption of GIS. In the oil industry Dangermond cited Statoil (ESRI user for 10 years), Petrobras (Brazilian E&P National Data Store) BP Baku-Tbilisi-Ceyhan pipeline, Shell’s 3D Analyst for subsurface and reservoir visualization, Tobin’s coupling of disparate GIS and tabular data, Landmark’s auto-generated contours and others.
Arc 9.x
Looking forward to ESRI’s 9.x release, Dangermond revealed that this would focus on Web Services, distributed GIS, process modeling, cartographic databasing, time-variant GIS and 3D visualization. With ArcObjects all tools will be available at ‘object level’. Dangermond anticipates a standards-based environment allowing for loosely-coupled integration with enterprise GIS. As an example, a flight line may come from one data server, and weather from a different server perhaps with different refresh rates etc. While in the current Arc 8x release the focus is on ‘making maps’, Arc 9.x will let developers ‘build applications using services’. ESRI will offer support for web services in three fashions—Java (IBM/Sun), .NET (Microsoft) and ‘generic’, open source environments. Likewise, ESRI’s Java support comes in three flavors. Map Objects for Java is written in ‘pure’ cross platform Java and is compatible with BEA WebLogic, IBM WebSphere and Open Source JBoss.
Innovations
Another innovation in Arc 9.x is support for ‘long transactions’ i.e. the ability to disconnect a part of the GIS dataset, to take it into the field for data edit, and to repatriate the changes in a consistent and conflict-free manner. Very large raster datasets can now be stored in the Geodatabase and ESRI has been working with BAE and ERDAS on feature extraction. The advent of massive amounts of LIDAR data has led to extensions for terrain mapping with Triangulated Irregular Networks (TIN). Raster datasets will benefit from the new scriptable geo-processing tools. These allow for the computation of parameters such as a ‘remoteness index’ or to perform image processing à la ER-Mapper. Temporal modeling provides time-variant represent-ations for SCADA and control rooms.
ArcGlobe
Dangermond noted that GIS is moving into the enterprise and that the future for ESRI lies in standards-based GIS. Web Services are at the heart of ESRI’s future offering which promises greatly increased functionality. A dramatic highlight followed Dangermond’s presentation with a demonstration of ESRI’s ArcGlobe a ‘whizz-bang’ application designed to offer stylish demonstrations of 3D GIS data in the boardroom. Starting from a view from space you can display in the usual ESRI fashion various themes: satellite imagery, roads, cloud cover etc. A geographical region can be selected from a gazetteer, targeted and zoomed in on. But the innovation of ArcGlobe is that the viewpoint can then seamlessly change from birds-eye to a fly-through of a digital terrain model. A great toy!
Plans
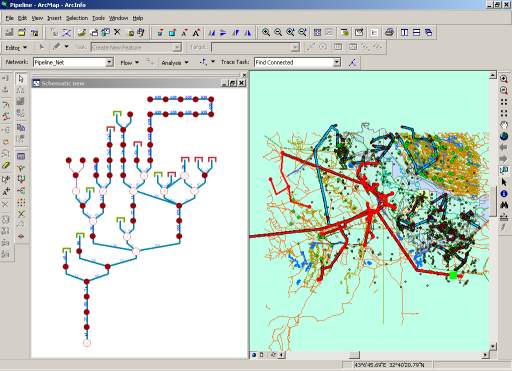
ESRI’s Clint Brown believes that the command line interface remains important to the GIS professional. So too are standards and Open Systems. ESRI now offers support for the ISO SQL/MM multi media (text, spatial and image SQL) standard and the OpenGIS Simple Feature model. Brown observed that database blobs support is now good and fast enough for image incorporation. A demo of ArcMap 8.3 showed how anomalies detected in pipeline pig surveys could be correlated with the grade of steel used in the pipe. ‘Error rules’ show where boundary conditions (for state or license contiguity for instance) are violated allowing for zoom in and edit. A ‘persistent state model’ in ArcSDE allows for ‘long transactions’—you can unplug a piece of the database for edit, then check it back in. A new network topology module allows spatial information in the Geodatabase to be viewed in both map and schematic forms.
Network image courtesy ESRI.
Network topologies such as pipelines can be visualized in the schematic with click-through to tabular data on features such as pipes and valves from the schematic. John Caulkin showed how raster maps of reservoir properties can be integrated intelligently with GIS and used for geoprocessing.
Migration
Occidental’s John Lineham gave a detailed cookbook for what needs to be checked and worked on during an ArcView Arc8 migration. There is a lot to do, maybe too much. Themes and symbology should be saved as AVL files and read in after migration. Avenue Scripts do not port. The Avenue conversion tool brings over 80% of the code but then hand tooling with Visual Basic is required. But many old Avenue scripts probably contain functionality which is built-in to Arc8 so check before re-writing code.
CAD-GIS Integration
Bryan Stoltenberg, (Blue Sky Development) believes that Computer Aided Design (CAD) data is “trapped in its own methodology and environment.” Likewise GIS is “a world unto itself.” But in pipeline engineering, these are forced to cohabit despite different philosophies concerning accuracy, coordinate systems etc. Stoltenberg proposes a platform-independent data representation, moving data definitions to a common, open format. Data elements thus defined can be linked to their original source via a unique identifier (UID). A projection manager maintains references between platforms, a common rendering system addresses objects resident in AutoCad, MicroStation and ESRI.
Enterprise GIS
Karl Fleischmann (ConocoPhillips Alaska) is a strong advocate of managing GIS data where it belongs—in the database. “Get out of shapefiles and into the data store—spatial is just ‘data’”. Spatial data should be centralized in Oracle, managed with automated processes and accessed in place from ‘shrink-wrap’ tools. ConocoPhillips’ Alaska Technical Database (ATD) manages technical and petro-technical data (including 900GB of image data) using ‘very robust’ security. The ATD uses an ArcSDE data store along with the production data sets. Unix cron jobs build spatial features (such as well deviation surveys) on the fly while ‘interlocking processes’ assure data integrity – for instance by recomputing formation tops.
Exprodat
Gareth Smith believes that GIS is the equivalent of the Moulinex food processor for the upstream. Exprodat has developed a ‘cookbook’ strategy for GIS deployment. The aim should be to provide a simple interface ‘for the masses’ first. These should offer ‘compelling’ content, leveraging high value corporate data and trusted external sources. They also should provide linkage to interpretation systems. Next the ‘back office’ support infrastructure can be established. Exprodat advocates using flat files and native raster imagery to avoid the cost and complexity of SDE. Problems were experienced with the ArcIMS generic Java viewer and Exprodat developed an ‘enhanced HTML’ viewer themselves.
IHS Energy
Tor Nielsen gave an insightful presentation on IHS Energy’s web services-based Common Architecture Project – a new IT architecture based on J2EE, Web Services and ESRI GIS Technologies. IHS Energy’s new web architecture will be a common source for graphs, reports, queries, maps, entitlements and authentication. The first web/GIS application, the GIS version of the IHS Energy Data Information Navigator EDIN-GIS has just been released. This ArcIMS HTML viewer (not Java implementation) is deployed with JavaScript for client side functionality. IHS Energy is working with Shell to provide 24x7 access around the world to its datasets “no more CDs!” A bespoke layer has been created to Shell’s specifications showing Shell’s partnerships and interests. Nielsen observed that cross-dataset query implies consistent or known units of measure (UOM) and nomenclature. “There are many matching issues – there is no easy answer”. Security across multiple clients’ firewall policies has proved problematical.
Open Source
On the economic front, IHS Energy deems Linux to be ‘very interesting’ although IHS ‘will stay with Sun for the next couple of years’. The price difference is however ‘too big to ignore’. Another sortie into Open Source territory involves trialing of MySQL, the Open Source database management system. Oracle is ‘very expensive’ for multiple offices and data centers due to its CPU-based licensing. ESRI is porting major pieces of code to Linux/MySQL. Finally Nielsen gave a thumbs-up to Apache Jakarta - TomCat and Jboss components which ‘can take you a fair way along the road.’
Landmark
According to Robert Warford, Landmark sank around $ 1 million in ArcView extensions notably for OpenExplorer. Then “along came Arc8!” Landmark is a big Unix/Java shop and selected MapObjects which offers “impressive lightweight, robust, quickly built applications. The network becomes the access protocol”. Map Objects are deployed at the top tier Surf & Connect Web edition. ArcIMS has brought seismic data visualization to the desktop and will be extended to other data types. Map Objects make Surf & Connect platform independent, running on Windows, Linux and UNIX. With MapObjects, maps become scale sensitive (more detail is revealed on zoom) and gridded data from OpenWorks can be displayed. Shell’s Bryan Prather demoed Surf and Connect web edition offshore blocks from Shell’s New Orleans server and well bore trajectories from Houston.
Marathon
Joe Kostecka (Marathon) and Darcy Vaughn (PetroWeb) provided an update on Marathon’s dual level portal deployment. Marathon uses several ‘second level’ vendor portals from Paradigm, Tobin and Landmark. All these are accessible through the top-level PetroWeb portal. GIS is a common interface to all data. Vaughn described how PetroWeb provides access to distributed data stores and how proprietary stuff like land positions remain within Marathon’s firewall. PetroWeb uses a ‘firewall friendly’ thin client browser offering easy deployment and satisfying corporate IT security. PetroWeb tried the ‘thick client’ (Java Map Objects) before abandoning it. ‘There is little which can’t be done on a thin client’. ArcIMS is the publishing solution for all GIS. This blends multi-source data at the desktop from around 40 data vendors with arrangements with PetroWeb. ESRI has given a ‘big kick-start’ to spatial data provision. Shape files are a thing of the past—data is now served from the spatial database.
MetaCarta
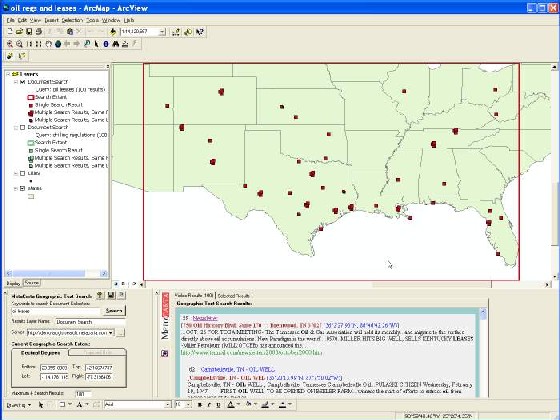
GIS/Text Search - image courtesy MetaCarta.
MetaCarta’s GIS-constrained text searching technology (see below) gets our virtual ‘star of the show’ award. MetaCarta couples GIS and text by integrating a geographical place-name lexicon with a text search engine. Office and HTML documents are indexed by MetaCarta’s Geographical Text Search engine such that all place names recognized in free-text documents are spatially located. This then makes for interesting to and fro searching between text and spatially-delineated areas.
Geocoding
We spotted an interesting geocoding application from Paradigm (pdigm.com) Paradigm’s community awareness service uses pipeline centerline data to locate people living within the specified distance. This can save considerable postal costs over bulk mailings to the postal carrier route or to the whole zip code. Another example of innovative GIS use came from PBSJ whose corridor constraints analysis helps environmental workers permit oil and gas pipelines. R7 Solutions has just released GeoRoom—a front end to data in disparate datastores such as Finder and P2000. The software offers the casual data room user a single entry point to spatial data avoiding multiple interfaces. Amerada Hess is a user. GeoRoom uses Microsoft SharePoint Services and has hooks into FileNet (Hess’ document management system).
Tobin
Tobin’s Vendor Data Index allows users to search data from multiple vendors from a single map interface and to overlay and compare with in-house data. Information on data located though the WebViewer can be listed in terms of header information and spatial representation. Data types include seismic, well logs, production and other Tobin Data.
MJ Harden
MJ Harden has developed a new field data collection tool for pipeline engineers and is working with ESRI on pipeline-specific schematics. ArcPad is now embedded in MJ Harden applications.
This article has been abstracted from a 24 page illustrated report produced as part of The Data Room’s Technology Watch service. For more information email info@oilit.com.
© Oil IT Journal - all rights reserved.